Edit
This section illustrates operations and applications of items under Edit menu.
Generate report
This group of menu items will lead you to generate grid report, grouped report and crosstab report.
Grid
This item guides you to select an existing data set and create a new grid report.
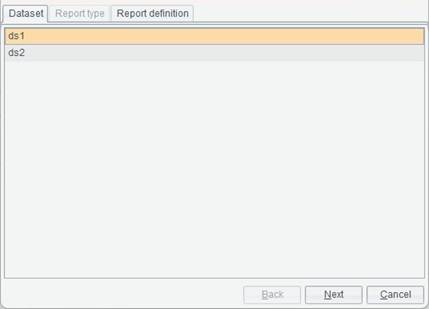
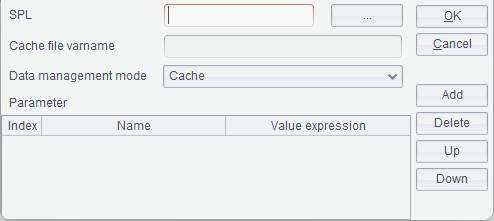
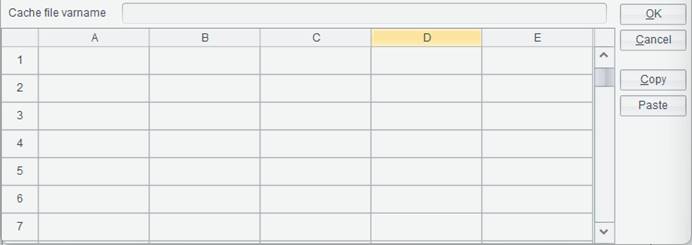
Click Edit -> Generate report -> Grid to enter the dataset wizard. When there is only one existing data set, the wizard will be automatically skipped and you directly enter the Report definition tab:
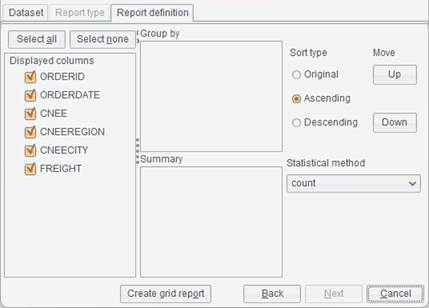
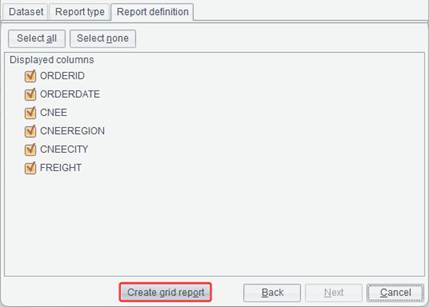
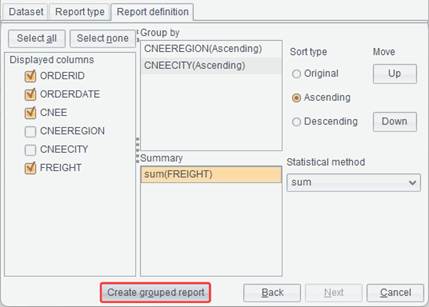
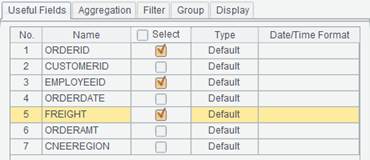
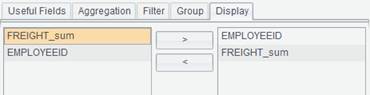
On the Report definition tab, select fields to be displayed on the grid report, as shown below:
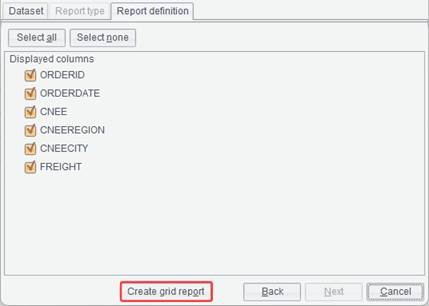
Under Displayed Columns there are all field names that can be displayed. Select field names you want display in the report, click Create grid report button and you enter the report editing interface. Now a grid report is created.
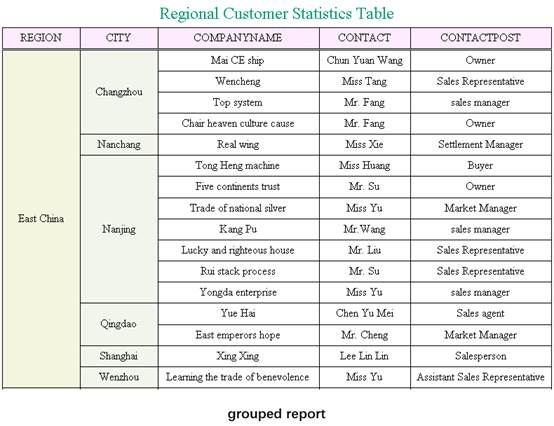
Grouped
This item guides you to select an existing data set and create a new grouped report.
Click Edit -> Generate report -> Grouped to enter the dataset wizard. When there is only one existing data set, the wizard will be automatically skipped and you directly enter the Report definition tab:
Click Next button and enter Report definition tab:
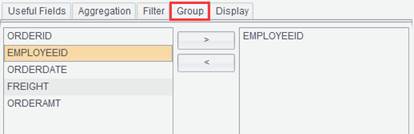
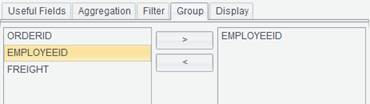
First, drag the grouping field to Group by box. Same way for defining a multilevel grouped report, for which we can adjust the order of levels through Move Up/Down buttons.
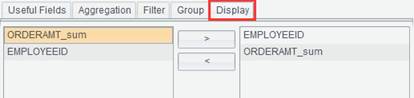
Then, drag the target field to be summarized to Summary box and select a function in the Statistical method drop-down list.
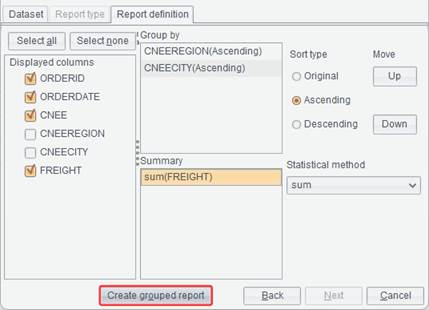
Last, click Create grouped report button to get into the grouped report editing interface, where report expressions are already automatically generated.
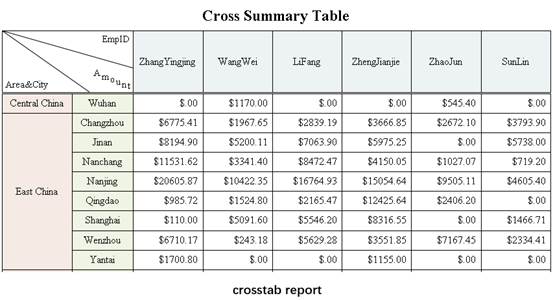
Crosstab
This item guides you to select an existing data set and create a new crosstab report.
Click Edit -> Generate report -> Crosstab to enter the dataset wizard. When there is only one existing data set, the wizard will be automatically skipped and you directly enter the Report definition tab:
Click Next button and enter Report definition tab:
On this interface, you can define row header, column header and slash-separated cell value for the new crosstab report.
First, define row header of the crosstab report.
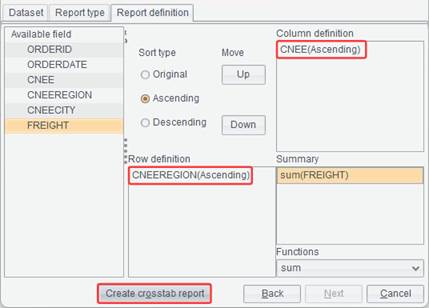
On the above interface, select a field by which the row header is grouped from the Available field box, where fields are arranged in a tree structure, and drag it to Row definition box. To group rows by CNEEREGION for instance, we drag CNEEREGION field to Row definition box and the field will be displayed under Row definition (in ascending order). If you want the descending order, select Descending option under Sort type.
Then define the crosstab report’s column header in the same way. To group by CNEE field, drag this field to Column definition box.
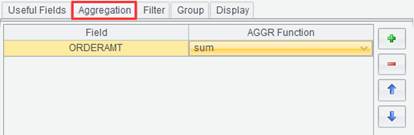
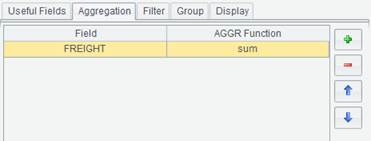
Last, define the cross item of the crosstab report. To calculate the total freight, drag FREIGHT field to Summary box and select sum function in the Functions drop-down list to perform SUM on FREIGHT field.
Click Create crosstab report button to get into the crosstab report editing interface, where report expressions are already automatically generated.
Wizard new
This menu item guides you through creating a new report file.
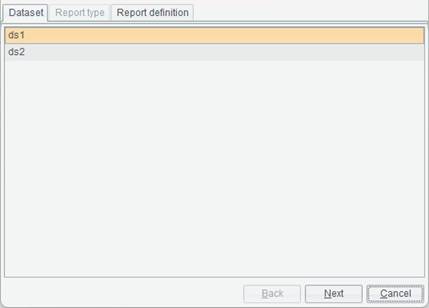
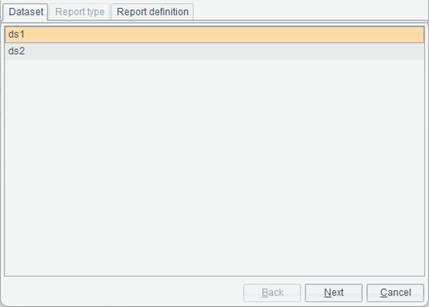
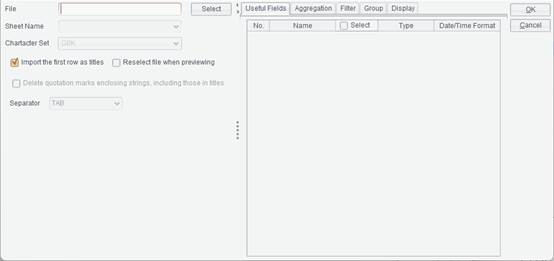
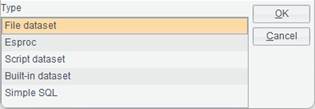
Click Edit -> Wizard new to get into dataset dialog:

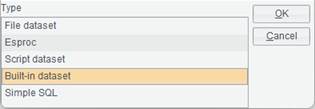
Click Next button to select a report type – grid report, grouped report or crosstab report.
Ø Grid report
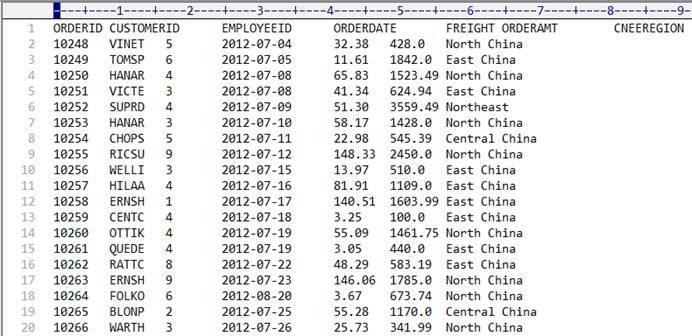
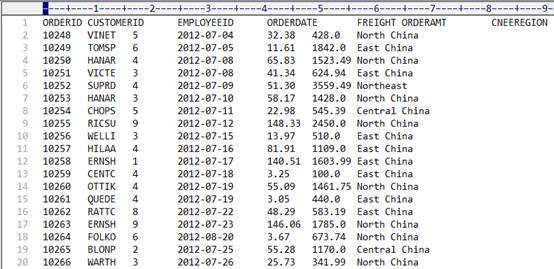
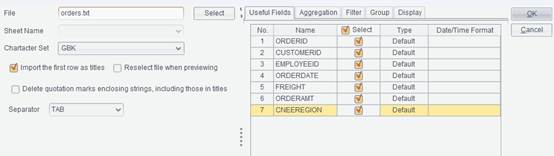
Step 1: click File -> Open dataset or Report -> Dataset to create a new data set. Here we use the ReportLite built-in demo data source to create a new SQL data set. Select ORDERS table (before this you need to first connect to the data source through Tools -> Datasource).
Step 2: Select Grid report type.
Click Next to get into the following tab:
Step 3: Under Displayed columns where all column names are displayed, select columns to be displayed in the report, and click Create grid report button to get into the report editing interface. Now a grid report is finished creating. If all column names under Displayed columns need to be displayed in the report, select all of them; or in Step 2, directly click Create grid report button after selecting Grid report type.
That’s all for creating a grid report. If you want to create a grouped report through the wizard, select Grouped report type in Step 2, as shown below:
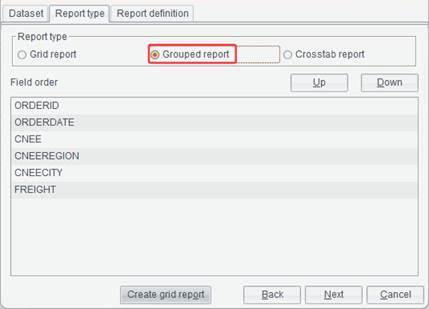
Ø Grouped report
Select the target report type, click Next to get into the Report definition tab:
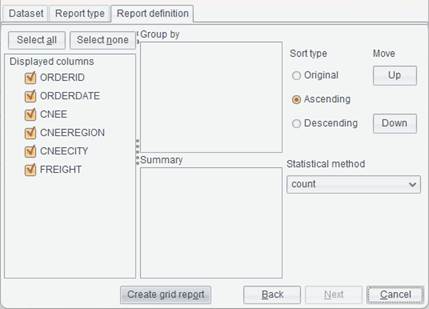
First, drag the grouping field to Group by box. Same way for defining a multilevel grouped report, for which we can adjust the order of levels through Move Up/Down buttons.
Then, drag the target field to be summarized to Summary box and select a function in the Statistical method drop-down list.
Last, click Create grouped report button to get into the grouped report editing interface, where report expressions are already automatically generated.
Ø Crosstab report
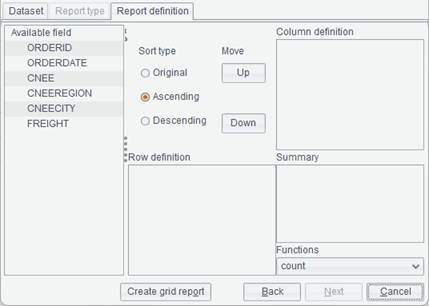
If you want to create a crosstab report through the wizard, select Crosstab report type in Step 2, and click Next to get into the Report definition tab:
On this interface, you can define row header, column header and slash-separated cell value for the new crosstab report.
First, define row header of the crosstab report.
On the above interface, select a field by which the row header is grouped from the Available field box, where fields are arranged in a tree structure, and drag it to Row definition box. To group rows by CNEEREGION for instance, we drag CNEEREGION field to Row definition box and the field will be displayed under Row definition (in ascending order). If you want the descending order, select Descending option under Sort type.
Then define the crosstab report’s column header in the same way. To group by CNEE field, drag this field to Column definition box.
Last, define the cross item of the crosstab report. If we want to calculate the total freight, drag FREIGHT field to Summary box and select sum function in the Functions drop-down list to perform SUM on FREIGHT field.
Click Create crosstab report button to get into the crosstab report editing interface, where report expressions are already automatically generated.
Undo
You can undo the last operation through this item.
Click Edit -> Undo, or press Ctrl+Z to cancel the last operation.
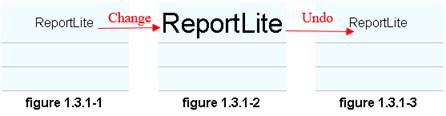
For instance, content of a cell is ReportLite and the font size was 12 pt (as figure 1.3.1-1 shows), but then the font size is changed to 26 pt (as figure 1.3.1-2 shows). Now you want to change the font size back to 12 pt. To do this, just click Edit -> Undo (as figure 1.3.1-3 shows).
Redo
You can recover the status before performing undo through this item.
If you want to cancel the undo operation, click Edit -> Redo, or press Ctrl+Y to go back to the status before undo.
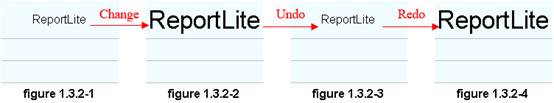
For instance, enter ReportLite in a cell and set font size as 12pt (as figure 1.3.2-1 shows), and then change the font size to 26pt (as figure 1.3.2-2 shows). Click Edit -> Undo to change the font size back to 12pt (as figure 1.3.2-3 shows). Then if you want to change it to 26pt again, just click Edit -> Redo (as figure 1.3.2-4 shows).
Cut
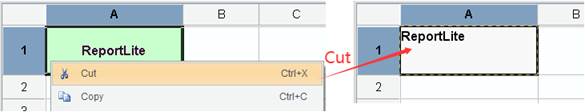
This item is used to cut information of the selected cell(s) or of all cells of the selected row(s)/column(s) for Paste.
Select information to be cut, and click Edit -> Cut, or Right-click menu -> Cut, or press Ctrl+X to perform the cut operation, as the following figure shows:
Note: You cannot cut part of a merge cell.
Copy
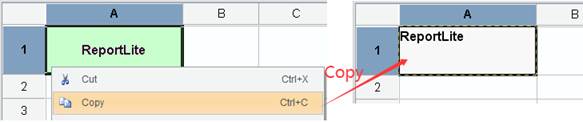
This item is used to copy information of the selected cell(s) or of all cells of the selected row(s)/column(s) for Paste.
Select information to be copied, and click Edit -> Copy, or Right-click menu -> Copy, or press Ctrl+C to perform the copy operation, as the following figure shows:
Paste
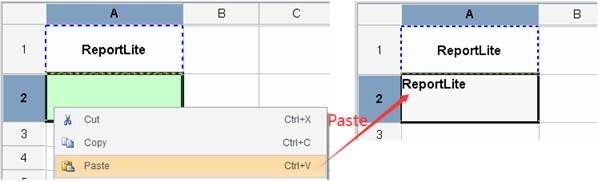
This item is used to paste the cut or copied content in a position the mouse pointer is placed.
Specify the position at which the cut or copied content will be pasted, and click Edit -> Paste or Right-click menu -> Paste or press Ctrl+V to perform the paste operation.
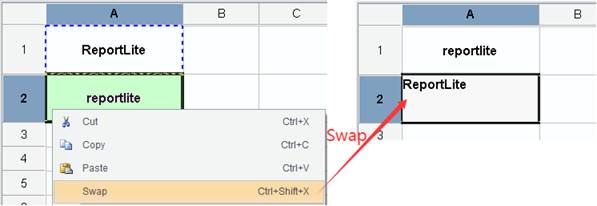
Swap
This menu item allows you to swap the content in the clipboard with the content at the mouse-specified location.
Cut the target content, specify the new location to which the content will be placed, and click Edit -> Swap or Right-click menu -> Swap, or sue the shortcut key Ctrl+Shift+X to perform the swap operation.
Insert
This series of menu items include Insert rows above/below, Insert columns to the left/right, Insert cells to the left/right, Append rows/columns, Left/Top master cell, Rows/Columns.
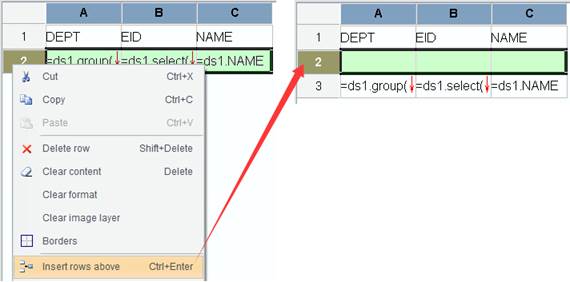
Insert rows above
This item allows you to insert a row above a selected row or cell.
Select a row, and click Edit -> Insert -> Insert rows above or Right-click menu -> Insert rows above or press Ctrl+Enter to insert a row above the selected position. As the following figure shows, select the 2nd row:
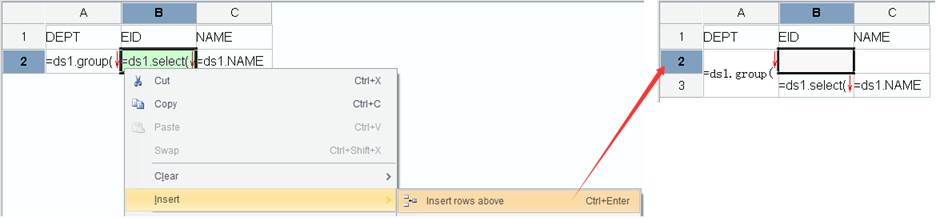
Select a cell, and click Edit -> Insert -> Insert rows above or Right-click menu -> Insert rows above or press Ctrl+Enter to insert a row above the selected position.When the selected cell has its master cell, this insert operation will result in the master cell’s automatic merge. Select C2 or B2 in the 2nd row, for example:
Insert rows below
This item allows you to insert a row below a selected row or cell.
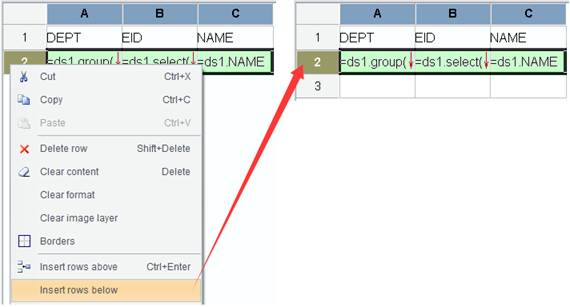
Select a row, and click Edit -> Insert -> Insert rows below or Right-click menu -> Insert rows below to insert a row below the selected position. As the following figure shows, select the 2nd row:
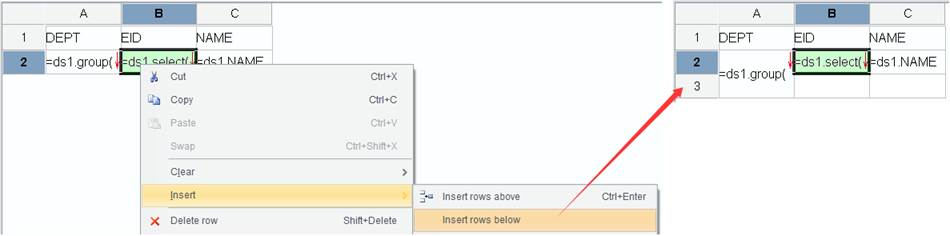
Select a cell, and click Edit -> Insert -> Insert rows below or Right-click menu -> Insert rows below to insert a row below the selected position. When the selected cell has its master cell, this insert operation will result in the master cell’s automatic merge. Select C2 or B2 in the 2nd row, for example:
Insert columns to the left
This item allows you to insert a column to the left of a selected column or cell.
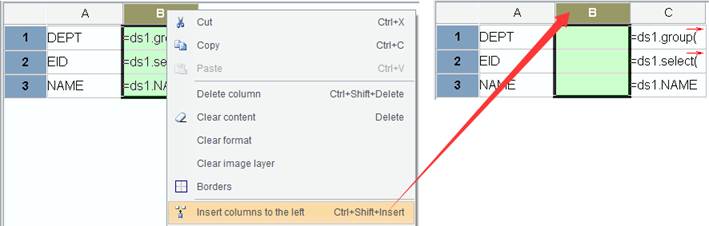
Select a column, and click Edit -> Insert -> Insert columns to the left or Right-click menu -> Insert columns to the left or press Ctrl+Shift+Insert to insert a column to the left of the selected position. As the following screenshot shows, select the 2nd column:
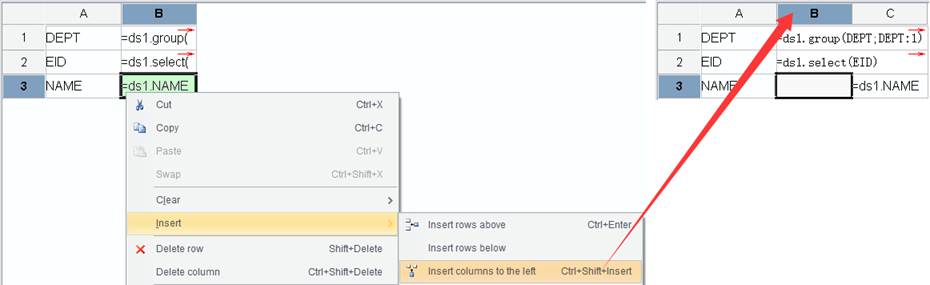
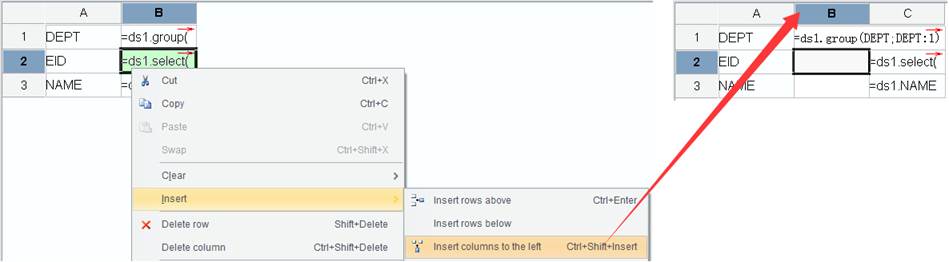
Select a cell, and click Edit -> Insert -> Insert columns to the left or Right-click menu -> Insert columns to the left or press Ctrl+Shift+Insert to insert a column to the left of the selected position.When the selected cell has its master cell, this insert operation will result in the master cell’s automatic merge. Select B2 or B3 in the 2nd column, for example:
Insert columns to the right
This item allows you to insert a column to the right of a selected column or cell.
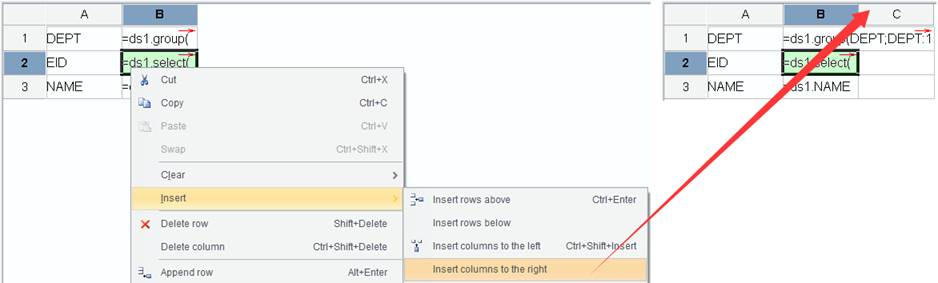
Select a column, and click Edit -> Insert -> Insert columns to the right or Right-click menu -> Insert columns to the right to insert a column to the right of the selected position. As the following screenshot shows, select the 2nd column:
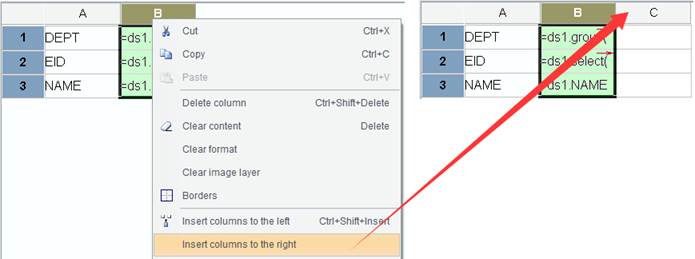
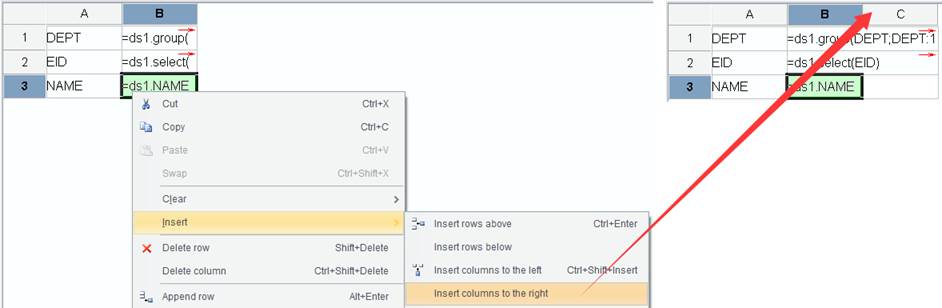
Select a cell, and click Edit -> Insert -> Insert columns to the right or Right-click menu -> Insert columns to the right to insert a column to the right of the selected position. When the selected cell has its master cell, this insert operation will result in the master cell’s automatic merge. Select B2 or B3 in the 2nd column, for example:
Left master cell
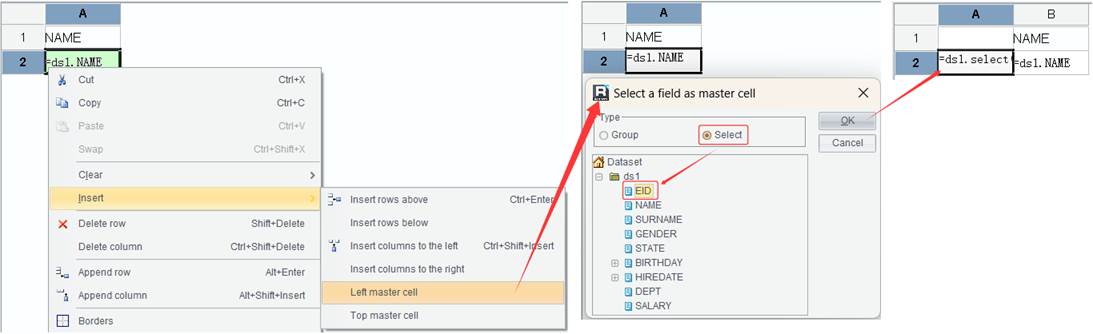
This item allows you to insert a column to the right of a selected cell and set the expression in the left master for this cell.
Select a cell, and click Edit -> Insert -> Left master cell or Right-click menu -> Insert -> Left master cell to insert a column to the left of the selected position. Select A2, for example:

Top master cell
This item allows you to insert a row above a selected cell and set the expression in the top master for this cell.
Select a cell, and click Edit -> Insert -> Top master cell or Right-click menu -> Insert -> Top master cell to insert a row above the selected position. Select B1, for example:

Append rows
This item allows you to add a row after the last row of a report.
Click Edit -> Insert -> Append rows or Right-click menu -> Append rows or press Alt+Enter to add a row after the last row. As the following figure shows, select the 1st row:
Append columns
This item allows you to add a column after the last column of a report.
Click Edit -> Insert -> Append columns or Right-click menu -> Append columns or press Alt+Shift+Insert to add a column after the last column. As the following figure shows, select the 1st column:
Insert cells to the left
This item allows you to insert a cell to the left of a selected cell.
Select a cell, and click Edit -> Insert -> Insert cells to the left or press Ctrl+Insert to insert a cell to the left of the selected position. As the following figure shows, select A2:
Insert cells to the right
This item allows you to add a cell to the right of a selected cell.
Select a cell and click Edit -> Insert -> Insert cells to the right or press Alt +Insert to add a cell to the right of the selected cell. Select A2, for example:
Rows
Through this item, you can insert a row zone having rows of a different type.
Click Edit -> Insert -> Rows, select a row type and the number of rows to be inserted on the pop-up Insert type dialog, and click OK, as the following shows:
Columns
Through this item, you can insert a column zone having columns of a different type.
Click Edit -> Insert -> Columns, select a column type and the number of columns to be inserted on the pop-up Insert type dialog, and click OK, as the following shows:
Delete
This series of items include Delete row/column/cell operations.
Delete row
This item allows you to delete delete a selected row or the row containing a selected cell.
Select a row, and click Edit -> Delete -> Delete row or Right-click menu -> Delete row or press Shift+Delete to delete the selected row. As the following figure shows, select the 2nd row:
Select a cell, and click Edit -> Delete -> Delete row or Right-click menu -> Delete row or press Shift+Delete to delete the selected row. When the selected cell has its master cell, this delete operation only deletes its subrows without affecting data in the master cell. Select B2 or C2 in the 2nd column, for example:
Delete column
This item allows you to delete a selected column or the column containing a selected cell.
Select a column, and click Edit -> Delete -> Delete column or Right-click menu -> Delete column or press Ctrl+Shift+Delete to delete the selected column. Select the 2nd column, for example:
Select a column, and click Edit -> Delete -> Delete column or Right-click menu -> Delete column or press Ctrl+Shift+Delete to delete the selected column. When the selected cell has its master cell, this delete operation only deletes its subcolumns without affecting data in the master cell. Select B2 or B3 in the 2nd column, for example:
Delete previous cell
Through this item, you can delete a cell before a selected cell.
Click Edit -> Delete -> Delete previous cell or press Ctrl+Backspace to delete the cell before the selected cell. As the following figure shows, select B2:
Clear
This series of menu items include Set as blank, Reset cell, Clear format, Clear content, and Clear image layer.
Set as blank
Through this item, you can set cells of certain rows/columns or certain cells as blank. A blank cell does not store any property information, but is only for holding the place, ensuring that the report is always a complete rectangle. It almost does not take up the memory space. As every report has a rectangular structure, we cannot just delete a cell from it but we can set useless cells as blank. A blank cell represents null in the memory and does not use any memory resource.
Select the target cell or cells, and click Edit -> Clear -> Set as blank or Right-click menu -> Clear -> Set as blank or press Ctrl+D to change them into blank cells. As the following figure shows, select A2:

Reset cell
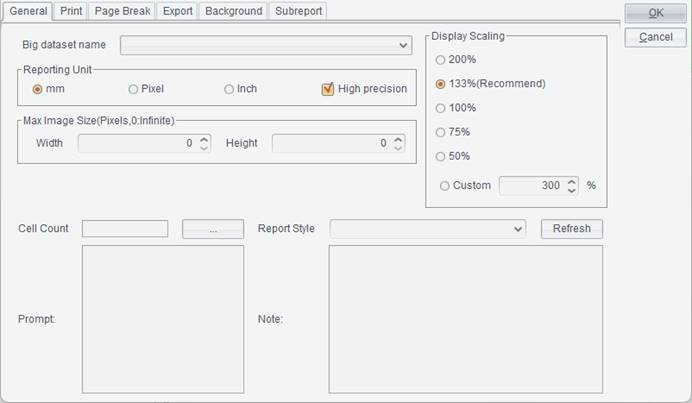
Through this item, you can set a selected cell as an initial cell. An initial cell is one that has properties set in Tools -> Options -> Initial properties, as the following figure shows:
An initial cell isn’t a blank cell. The latter does not store any property information but is only used to hold the place in order to make sure the report is always a complete rectangle. It almost does not use any memory space. An initial cell, however, stores property information that is configure in Tools -> Options -> Initial properties.
Select a target cell, and click Edit -> Clear -> Reset cell or Right-click menu -> Clear -> Reset cell to set the cell as the initial cell. Here the initial cell has default properties the system specifies. As the following figure shows, select A1:
Clear format
Through this item, you can clear the formatting information in the selected cell(s) or in all cells of the selected row(s)/column(s).
Click primary cell of a row or a column or select one or more cells, and click Edit -> Clear -> Clear format or Right-click menu -> Clear -> Clear format to delete their formats. As the following figure shows, select A1:
Clear content
Through this item, you can clear the contents of in the selected cell(s) or in all cells of the selected row(s)/column(s).
Click primary cell of a row or a column or select one or more cells, and click Edit -> Clear -> Clear content or Right-click menu -> Clear -> Clear content or press Delete to delete their contents. As the following figure shows, select A1:
Clear image layer
Through this item, you can clear existing image layers from cells.
Select one or more cells for which image layer is already configured, and click Edit -> Clear -> Clear image layer or through Right-click menu -> Clear -> Clear image layer to delete their image layer property.
Move
This series of menu items include Move row/column/cell operations.
Move row up
Through this item, you can move up a selected row of a row holding the selected cell.
Select a row or a cell in a row, and click Edit -> Move -> Move row up or press Ctrl+Alt+Up to move up the row. As the following figure shows, select B2:
Move row down
Through this item, you can move down a selected row of a row holding the selected cell.
Select a row or a cell in a row, and click Edit -> Move -> Move row down or press Ctrl+Alt+Down to move down the row. As the following figure shows, select A1:
Move column left
Through this item, you can move a selected column of a column holding the selected cell leftward.
Select a column or a cell in a column, and click Edit -> Move -> Move column left or press Ctrl+Alt+Left to move the column leftward. As the following figure shows, select B2:
Move column right
Through this item, you can move a selected column of a column holding the selected cell rightward.
Select a column or a cell in a column, and click Edit -> Move -> Move column right or press Ctrl+Alt+Right to move the column rightward. As the following figure shows, select A2:
Move cell up
Through this item, you can move up a selected cell.
Select a cell, and click Edit -> Move -> Move cell up or press Alt+Up to move up the cell.
Move cell down
Through this item, you can move down a selected cell.
Select a cell, and click Edit -> Move -> Move cell down or press Alt+Down to move down the cell.
Move cell left
Through this item, you can move a selected cell leftward.
Select a cell, and click Edit -> Move -> Move cell left or press Alt+Left to move the cell leftward.
Move cell right
Through this item, you can move a selected cell rightward.
Select a cell, and click Edit -> Move -> Move cell right or press Alt+Right to move the cell rightward.
Find
This item is for finding the specified content in the report.
Click Edit -> Find or press Ctrl+F to get the following dialog:
Enter the content you want to find in Find what box, check Case sensitive or Whole words only and select an option under Look in, and click Search button. Each click will select and display the cell containing the target content.
Replace
This item is for replacing the specified content of the report with other content.
Click Edit -> Replace or press Ctrl+R to get the Find dialog. Enter the content you want to find in Find what box and the content with which you want to replace it in Replace with box, check Case sensitive or Whole words only and select an option under Look in, and click Replace button. Each click will replace an eligible target. Click Replace all to replace all targets at once.